
Quarterly Price Updates July 2026
Updated material prices available now
Every quarter Clear Estimates updates the material price for every region in the U.S., across all 10,000+ parts in our database. These updates are automatically available in your Clear Estimates Software. Check out how the prices of different projects have changed regionally this past quarter!
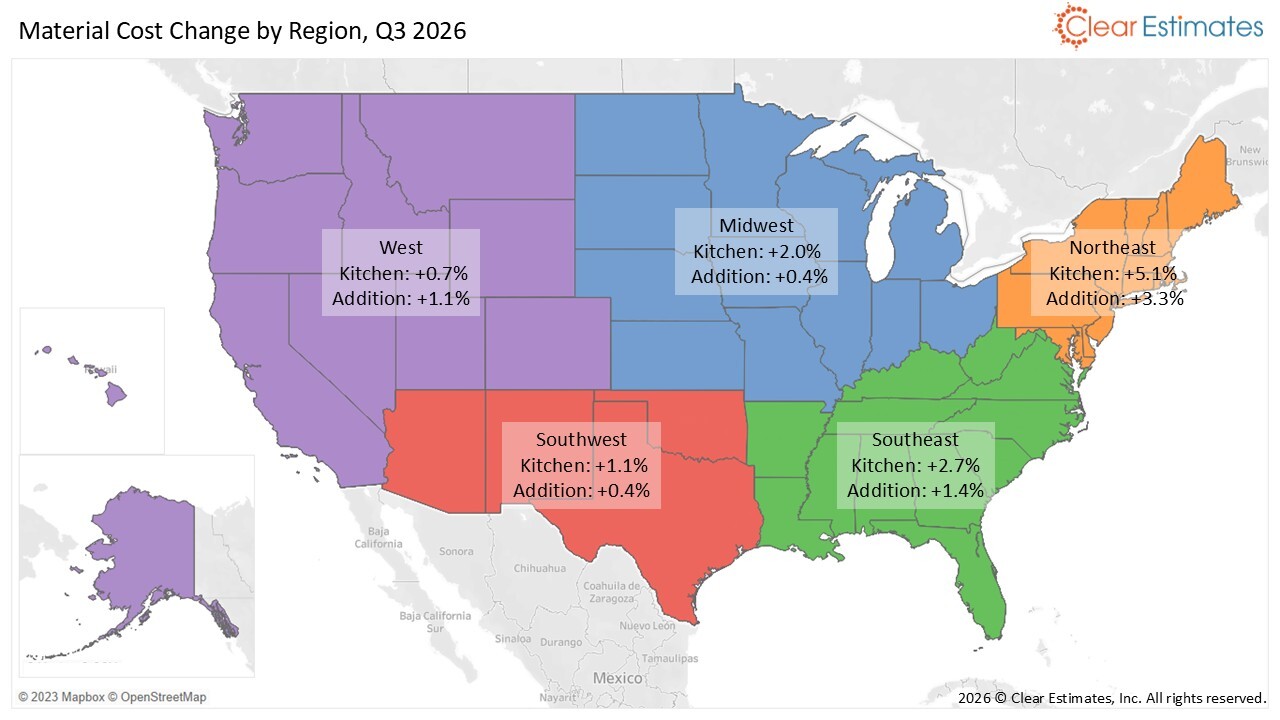
Check out how the cost of a 200 sq. foot kitchen remodel has changed since last quarter:
- Northeast: +5.1%
- Southeast: +2.7%
- Midwest: +2.0%
- Southwest: +1.1%
- West: +0.7%
See how the cost of an 800 sq. foot home addition has changed since last quarter:
- Northeast: +3.3%
- Southeast: +1.4%
- Midwest: +0.4%
- Southwest: +0.4%
- West: +1.1%
Part Analysis "Deep Dive"
We're committed to delivering the most accurate and up-to-date pricing data in the residential construction industry, drawn from a broad network of trusted sources. This section offers a behind-the-scenes look at the data and analysis that make that possible.
Brick remains one of the most durable and attractive exterior cladding options for residential construction and renovation. Whether you're building a new home, adding a garage, or repairing an existing façade, material costs can vary substantially by location. The map below illustrates estimated material costs for a standard 4-inch residential brick wall across the United States in Q3 2026, while the accompanying chart tracks changes in the national average over the past eight years.
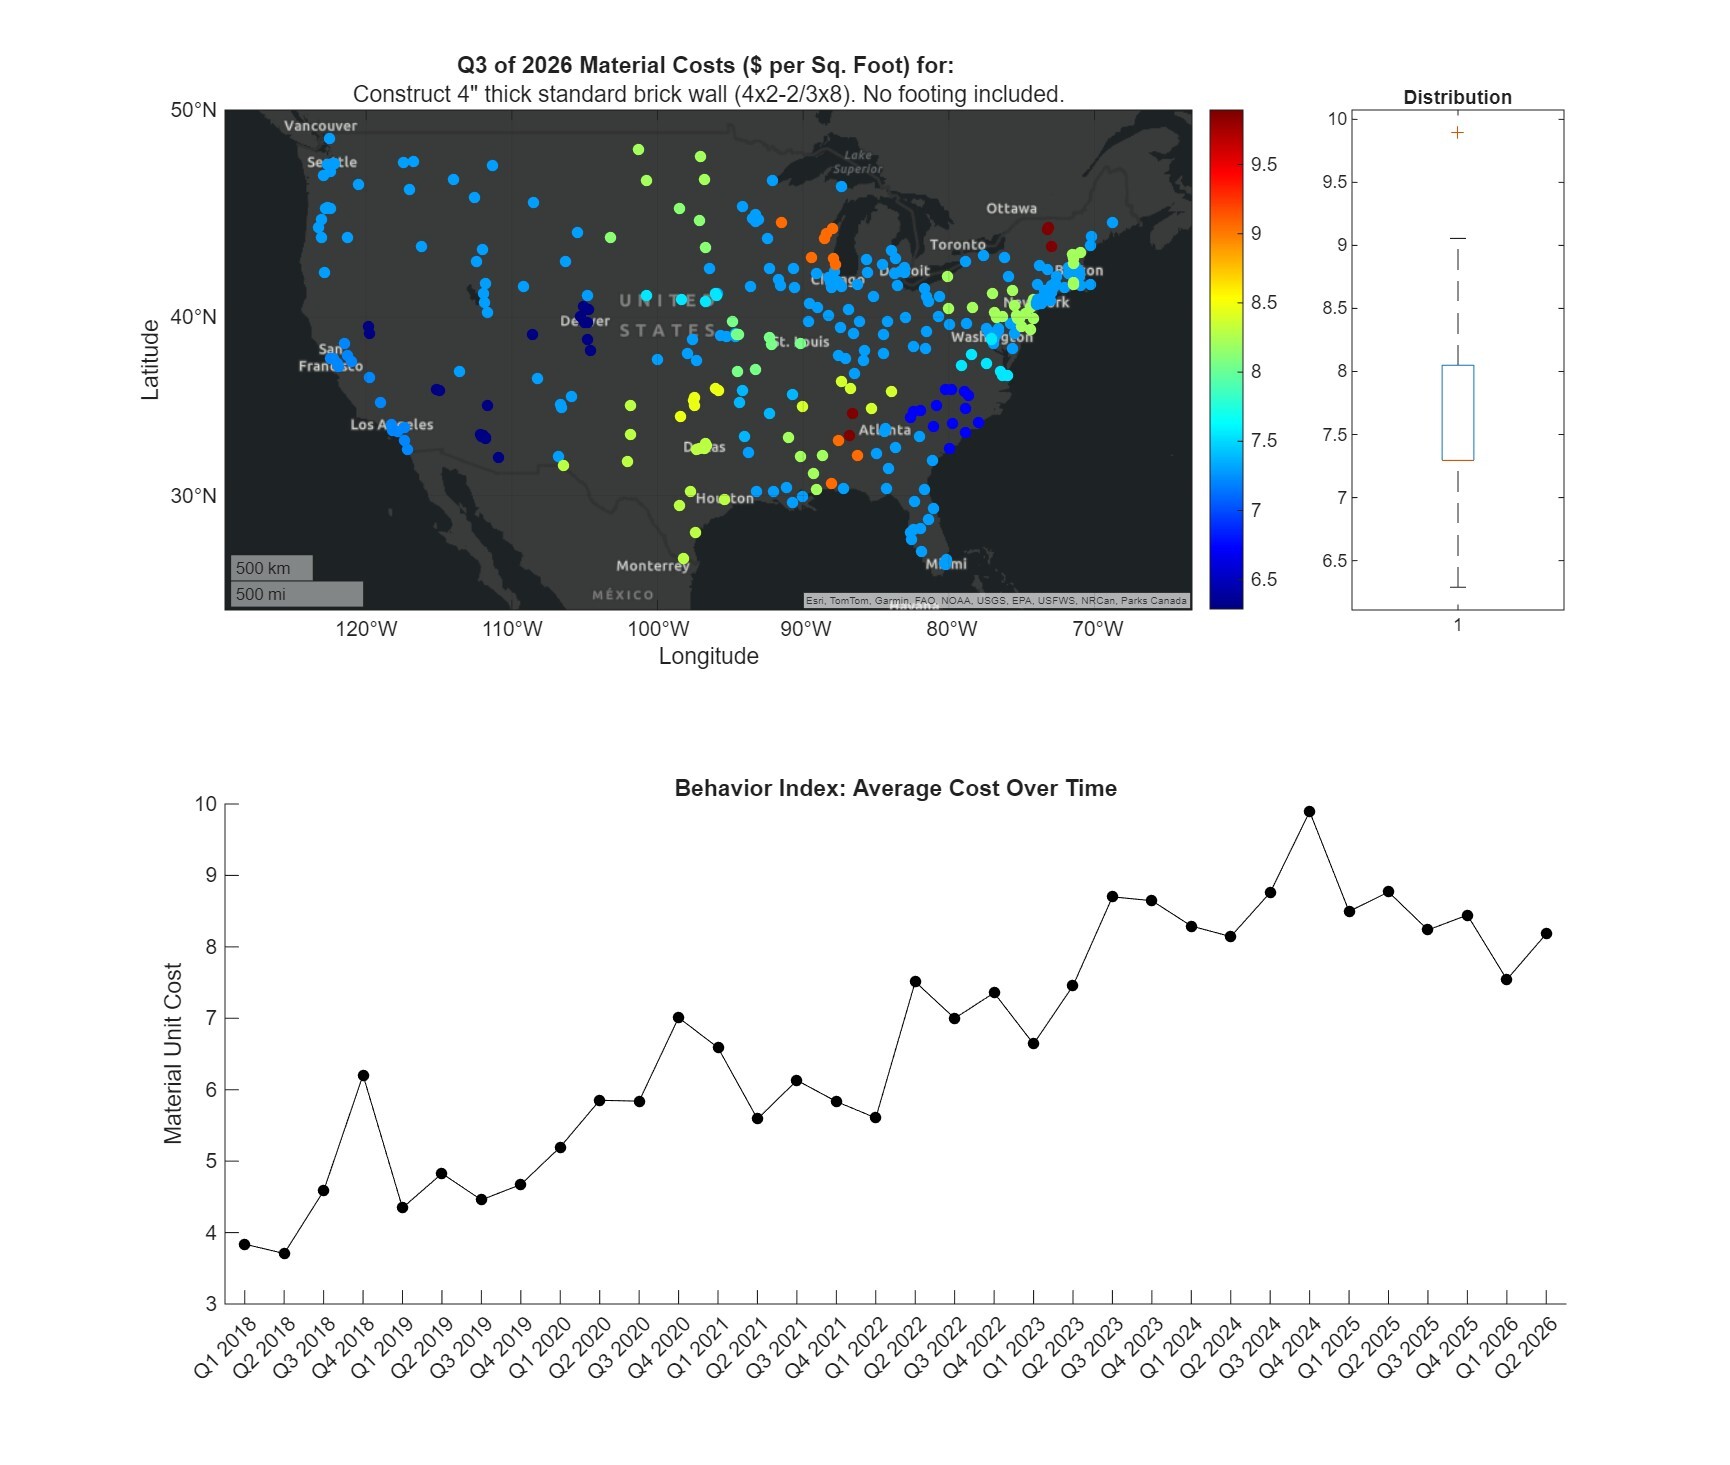
A few patterns stand out. Material costs are relatively high in the Northeast, with a noticeable band of elevated prices stretching from Texas through portions of the central Midwest. Meanwhile, much of the Mountain West and Pacific Coast falls closer to the national average or below.
Several factors likely contribute. Since brick is expensive to ship long distances, transportation costs can be significant - making proximity to manufacturers an important driver of price. Regional demand also plays a role. Areas experiencing strong residential or commercial construction activity can put upward pressure on local material pricing. Together, these factors create meaningful geographic variation, even for something as standard as a residential brick wall.
Here are some other trends:
- Fiberglass and asphalt roofing continued their upward climb, with double-digit quarter-over-quarter increases in every region except the West.
- Plywood prices also moved higher nationwide, with increases in parts of the Northeast exceeding 15% this quarter. The West experienced the smallest increase, averaging just 4%.
- Wall studs by contrast, remained stable or declined in price, with a national average change of -2%.
- Drywall pricing was more mixed. Nationally, material costs rose an average of 7%, despite a 4% decline across much of the Midwest.
- Dimensional lumber showed some of the greatest regional variation. Prices surged in the Northeast, while much of the Midwest saw declining costs, with double-digit decreases in some markets.
We look forward to bringing you new and exciting information on pricing trends every quarter! Stay tuned for the next update.
